Volcanoplot
Example data from Galaxy training material: https://training.galaxyproject.org/training-material/topics/transcriptomics/tutorials/rna-seq-viz-with-volcanoplot/tutorial.html https://zenodo.org/record/2529117
Similar to the scatter plot but with some extra things that people were always asking me to do:
label/colour up/down large and small significance values differently.
annotate certain points on the volcanoplot
Parameters:
df: pd.DataFrame,
log_fc: str --> column with the logFoldChange values in it
p_val: str --> column with the p-values in it
label_column: str --> column with the genes in it
title='' --> title
xlabel='' --> xlabel
ylabel='' --> ylabel
invert=False --> whether or not you want to invert the data
p_val_cutoff=0.05 --> cutoff for the adjusted pvalue (for showing the colours)
log_fc_cuttoff=2 --> logFoldChange cutoff
colours=None --> a dictionary of colours for the low and high significant values
offset=None --> offset for the log10 computation
values_to_label=None --> a list that you want to label e.g. [gene1, gene2, ...] as strings.
max_labels=20 --> the maximum number of labels that you want to display on the graph (will show the top X values)
text_colours={} --> a dictionary of colours for the text of the values/genes you want to label on the volcano
values_colours={} --> a dictionary of colours for the background of the text for the values/genes you want to label on the volcano
figsize=(3, 3),
title_font_size=8,
label_font_size=6,
title_font_weight=700,
config={}
Config options = any of the parameters with the same name but with in a dictionary format instead, and also includes default parameters for the visualisation such as the font family and font.
Example config:
config={'figsize':(4, 5),  # Size of figure (x, y)
        'title_font_size': 16, # Size of the title (pt)
        'label_font_size': 12, # Size of the labels (pt)
        'title_font_weight': 700, # 700 = bold, 600 = normal, 400 = thin
        'font_family': 'sans-serif', # 'serif', 'sans-serif', or 'monospace'
        'font': ['Tahoma'] # Default: Arial  # http://jonathansoma.com/lede/data-studio/matplotlib/list-all-fonts-available-in-matplotlib-plus-samples/
}
Loading data
[1]:
import pandas as pd
from sciviso import Barchart, Boxplot, Heatmap, Histogram, Scatterplot, Violinplot, Volcanoplot, Line
import matplotlib.pyplot as plt

df = pd.read_csv('limma-voom_luminalpregnant-luminallactate.tsv', sep='\t')
df
[1]:
| ENTREZID | SYMBOL | GENENAME | logFC | AveExpr | t | P.Value | adj.P.Val | |
|---|---|---|---|---|---|---|---|---|
| 0 | 12992 | Csn1s2b | casein alpha s2-like B | -8.603611 | 3.562950 | -43.796498 | 3.830650e-15 | 6.053959e-11 |
| 1 | 13358 | Slc25a1 | solute carrier family 25 (mitochondrial carrie... | -4.124175 | 5.779699 | -29.907849 | 1.758595e-13 | 1.389642e-09 |
| 2 | 11941 | Atp2b2 | ATPase, Ca++ transporting, plasma membrane 2 | -7.386986 | 1.282143 | -27.819499 | 4.836363e-13 | 2.432800e-09 |
| 3 | 20531 | Slc34a2 | solute carrier family 34 (sodium phosphate), m... | -4.177812 | 4.278629 | -27.072723 | 6.157428e-13 | 2.432800e-09 |
| 4 | 100705 | Acacb | acetyl-Coenzyme A carboxylase beta | -4.314320 | 4.440914 | -25.223566 | 1.499977e-12 | 4.741129e-09 |
| ... | ... | ... | ... | ... | ... | ... | ... | ... |
| 15799 | 20525 | Slc2a1 | solute carrier family 2 (facilitated glucose t... | -0.000876 | 8.021892 | 0.000000 | 9.999997e-01 | 9.999999e-01 |
| 15800 | 103836 | Zfp692 | zinc finger protein 692 | -0.000015 | 4.837269 | 0.000000 | 9.999997e-01 | 9.999999e-01 |
| 15801 | 170718 | Idh3b | isocitrate dehydrogenase 3 (NAD+) beta | -0.000833 | 6.668953 | 0.000000 | 9.999998e-01 | 9.999999e-01 |
| 15802 | 71810 | Ranbp3 | RAN binding protein 3 | 0.000107 | 5.753686 | 0.000000 | 9.999998e-01 | 9.999999e-01 |
| 15803 | 19252 | Dusp1 | dual specificity phosphatase 1 | 0.000025 | 9.134574 | 0.000000 | 9.999999e-01 | 9.999999e-01 |
15804 rows × 8 columns
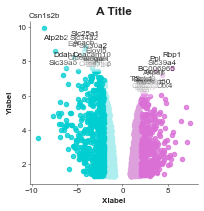
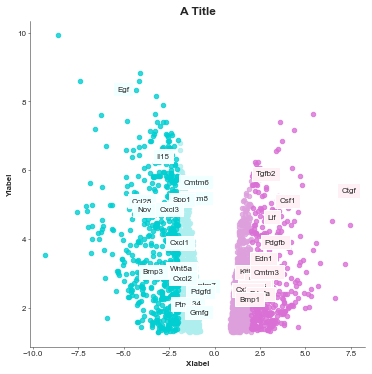
Volcano plot basic
[2]:
volcanoplot = Volcanoplot(df, 'logFC', 'adj.P.Val',
                          'SYMBOL', 'A Title',
                          'Xlabel', 'Ylabel',
                          label_big_sig=True)
volcanoplot.plot()
plt.show()
--------------------------------------------------------------------------------
No offset was provided, setting offset to be smallest value recorded in dataset:   6.05395889659601e-11
--------------------------------------------------------------------------------
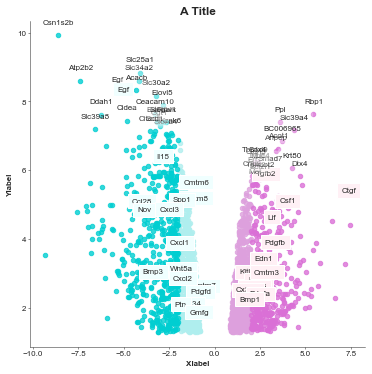
Volcano label certain genes
[3]:
gene_list = list(pd.read_csv('volcano_genes.tsv', sep='\t')['GeneID'].values)

volcanoplot = Volcanoplot(df, 'logFC', 'adj.P.Val',
                          'SYMBOL', 'A Title',
                          'Xlabel', 'Ylabel',
                          values_to_label=gene_list,
                          config={'figsize': (6,6)})
volcanoplot.plot()
plt.show()
--------------------------------------------------------------------------------
No offset was provided, setting offset to be smallest value recorded in dataset:   6.05395889659601e-11
--------------------------------------------------------------------------------
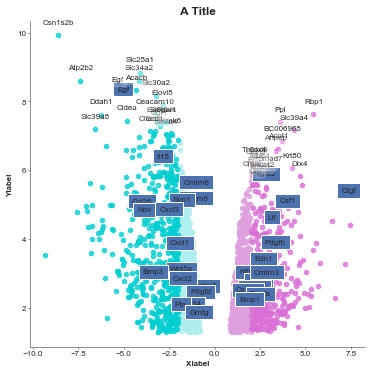
[4]:
## Update the default params to make it look nicer
gene_list = list(pd.read_csv('volcano_genes.tsv', sep='\t')['GeneID'].values)

# Colour the outside lightgrey
value_colours = {}
log_fc = df['logFC'].values
for i, g in enumerate(df['SYMBOL'].values):
    if g in gene_list:
        if log_fc[i] > 0:
            value_colours[g] = 'lavenderblush'
        else:
            value_colours[g] = 'azure'

# You could also explicityly set the colour for each gene just in a dictionary: {'gene': 'color'}

volcanoplot = Volcanoplot(df, 'logFC', 'adj.P.Val',
                          'SYMBOL', 'A Title',
                          'Xlabel', 'Ylabel',
                          values_to_label=gene_list,
                          values_colours=value_colours,
                          config={'figsize': (6,6)})
volcanoplot.plot()
plt.show()
--------------------------------------------------------------------------------
No offset was provided, setting offset to be smallest value recorded in dataset:   6.05395889659601e-11
--------------------------------------------------------------------------------
[5]:
volcanoplot = Volcanoplot(df, 'logFC', 'adj.P.Val',
                          'SYMBOL', 'A Title',
                          'Xlabel', 'Ylabel',
                          values_to_label=gene_list,
                          values_colours=value_colours,
                          max_labels=0, # The default of the max labels is 20 but you just set to however many values
                          # you want to display
                          config={'figsize': (6,6)})
volcanoplot.plot()
plt.show()
--------------------------------------------------------------------------------
No offset was provided, setting offset to be smallest value recorded in dataset:   6.05395889659601e-11
--------------------------------------------------------------------------------
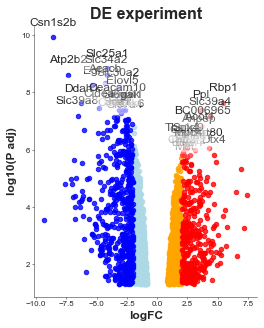
Advanced style options
Here are some examples with extra style options.
[6]:
colours = {'ns_small-neg-logFC': 'lightgrey',
                        'ns_small-pos-logFC': 'lightgrey',
                        'ns_big-neg-logFC': 'grey',
                        'ns_big-pos-logFC': 'grey',
                        'sig_small-neg-logFC': 'lightblue',
                        'sig_small-pos-logFC': 'orange',
                        'sig_big-neg-logFC': 'blue',
                        'sig_big-pos-logFC': 'red'}

volcanoplot = Volcanoplot(df,
                          log_fc='logFC',
                          p_val='adj.P.Val',
                            label_column='SYMBOL', # The column that we want to use to identify the values/labelling
                            title='DE experiment',
                            xlabel='logFC',
                            ylabel='log10(P adj)',
                            invert=False, # If you need to invert the data
                            p_val_cutoff=0.05, # Cutoff for the "significant" colours
                            log_fc_cuttoff=2,  # LogFC cutoff
                            colours=colours,  # colours of high and low colours
                            offset=None, # Offset for the log10 transformation
                            text_colours={}, # Colourmap like the colours but for the front facing text
                            values_to_label=None, # A list of values to label i.e. some genes of interest
                            max_labels=20,
                            values_colours={}, # Colours for that list as a dictionary
                            figsize=(3, 3), #
                            title_font_size=8,
                            label_font_size=6,
                            title_font_weight=700,
                          # Set points to be coloured by this column
                            # Config options = any of the parameters with the same name but with in a dictionary format instead
                             # You could also pass these as individual parameters, but it's easier to set as a dictionary
                            # also, then you can re-use it for other charts!
                          config={'s': 200, # Make points larger
                                  'figsize':(4, 5),  # Size of figure (x, y)
                                  'title_font_size': 16, # Size of the title (pt)
                                  'label_font_size': 12, # Size of the labels (pt)
                                  'title_font_weight': 700, # 700 = bold, 600 = normal, 400 = thin
                                  'font_family': 'sans-serif', # 'serif', 'sans-serif', or 'monospace'
                                  'font': ['Tahoma'] # Default: Arial  # http://jonathansoma.com/lede/data-studio/matplotlib/list-all-fonts-available-in-matplotlib-plus-samples/
                          })
volcanoplot.plot()
plt.show()
--------------------------------------------------------------------------------
No offset was provided, setting offset to be smallest value recorded in dataset:   6.05395889659601e-11
--------------------------------------------------------------------------------
Saving
Saving is the same for all plots and v simple, just make sure you specify what ending you want it to have.
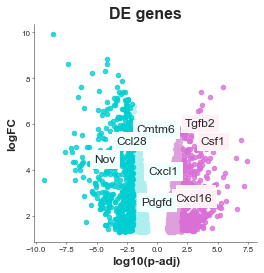
[13]:
## Update the default params to make it look nicer
gene_list = list(pd.read_csv('volcano_genes.tsv', sep='\t')['GeneID'].values)
gene_list = gene_list[:5] + gene_list[-5:]
# Colour the outside lightgrey
value_colours = {}
log_fc = df['logFC'].values
for i, g in enumerate(df['SYMBOL'].values):
    if g in gene_list:
        if log_fc[i] > 0:
            value_colours[g] = 'lavenderblush'
        else:
            value_colours[g] = 'azure'

# You could also explicityly set the colour for each gene just in a dictionary: {'gene': 'color'}

volcanoplot = Volcanoplot(df, 'logFC', 'adj.P.Val',
                          'SYMBOL', 'DE genes',
                          'log10(p-adj)', 'logFC',
                          values_to_label=gene_list,
                          values_colours=value_colours,
                          max_labels=0,
                          label_font_size=12,
                           config={'palette': ['orchid', 'paleturquoise', 'gold'],
                           'figsize':(4, 4),  # Size of figure (x, y)
                           's': 20,
                           'title_font_size': 16, # Size of the title (pt)
                           'label_font_size': 12, # Size of the labels (pt)
                           'title_font_weight': 700, # 700 = bold, 600 = normal, 400 = thin
                           'font_family': 'sans-serif', # 'serif', 'sans-serif', or 'monospace'
                           'font': ['Tahoma'] # Default: Arial  # http://jonathansoma.com/lede/data-studio/matplotlib/list-all-fonts-available-in-matplotlib-plus-samples/
                           })
volcanoplot.plot()
plt.savefig('volcano.svg', bbox_inches='tight') # .png, .pdf, .jpg
plt.savefig('volcano.png', dpi=300) # .png, .pdf, .jpg
plt.savefig('chart.pdf') # .png, .pdf, .jpg
--------------------------------------------------------------------------------
No offset was provided, setting offset to be smallest value recorded in dataset:   6.05395889659601e-11
--------------------------------------------------------------------------------