Histogram
Parameters:
df: pd.DataFrame
x: object
title=''
xlabel=''
ylabel=''
colour=None # named colour or HEX:  https://matplotlib.org/stable/gallery/color/named_colors.html
normalise=False
fit_norm=False  # See: https://seaborn.pydata.org/generated/seaborn.histplot.html
plot_rug=False  # See above link
plot_kde=False  # See above link
plot_hist=True  # See above link
bins=20  # How many bind there are
min_x=None
max_x=None
min_y=None
max_y=None
figsize=(3, 3)
title_font_size=12
label_font_size=8
title_font_weight=700
config={}
Config options = any of the parameters with the same name but with in a dictionary format instead, and also includes default parameters for the visualisation such as the font family and font.
Example config:
config={'palette': ['red', 'yellow', 'pink'],
       'figsize':(4, 5),  # Size of figure (x, y)
        'title_font_size': 16, # Size of the title (pt)
        'label_font_size': 12, # Size of the labels (pt)
        'title_font_weight': 700, # 700 = bold, 600 = normal, 400 = thin
        'font_family': 'sans-serif', # 'serif', 'sans-serif', or 'monospace'
        'font': ['Tahoma'] # Default: Arial  # http://jonathansoma.com/lede/data-studio/matplotlib/list-all-fonts-available-in-matplotlib-plus-samples/
}
Loading data
[1]:
import pandas as pd
from sciviso import Barchart, Boxplot, Heatmap, Histogram, Scatterplot, Violinplot, Volcanoplot, Line
import matplotlib.pyplot as plt

df = pd.read_csv('iris.csv')
df
[1]:
| sepal_length | sepal_width | petal_length | petal_width | label | |
|---|---|---|---|---|---|
| 0 | 5.1 | 3.5 | 1.4 | 0.2 | Iris-setosa |
| 1 | 4.9 | 3.0 | 1.4 | 0.2 | Iris-setosa |
| 2 | 4.7 | 3.2 | 1.3 | 0.2 | Iris-setosa |
| 3 | 4.6 | 3.1 | 1.5 | 0.2 | Iris-setosa |
| 4 | 5.0 | 3.6 | 1.4 | 0.2 | Iris-setosa |
| ... | ... | ... | ... | ... | ... |
| 145 | 6.7 | 3.0 | 5.2 | 2.3 | Iris-virginica |
| 146 | 6.3 | 2.5 | 5.0 | 1.9 | Iris-virginica |
| 147 | 6.5 | 3.0 | 5.2 | 2.0 | Iris-virginica |
| 148 | 6.2 | 3.4 | 5.4 | 2.3 | Iris-virginica |
| 149 | 5.9 | 3.0 | 5.1 | 1.8 | Iris-virginica |
150 rows × 5 columns
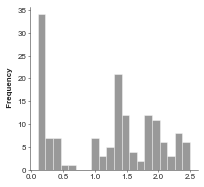
Basic histogram
[2]:
histogram = Histogram(df, 'petal_width', fit_norm=False, plot_rug=False)
histogram.plot()
plt.show()
/Users/ariane/opt/miniconda3/envs/clean_ml/lib/python3.6/site-packages/seaborn/distributions.py:2557: FutureWarning: `distplot` is a deprecated function and will be removed in a future version. Please adapt your code to use either `displot` (a figure-level function with similar flexibility) or `histplot` (an axes-level function for histograms).
  warnings.warn(msg, FutureWarning)
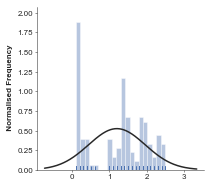
Histogram with normal line and rug
For more deatils on how these are calculated see seaborn: https://seaborn.pydata.org/generated/seaborn.histplot.html
[3]:
histogram = Histogram(df, 'petal_width', fit_norm=True, plot_rug=True)
histogram.plot()
plt.show()
/Users/ariane/opt/miniconda3/envs/clean_ml/lib/python3.6/site-packages/seaborn/distributions.py:2056: FutureWarning: The `axis` variable is no longer used and will be removed. Instead, assign variables directly to `x` or `y`.
  warnings.warn(msg, FutureWarning)
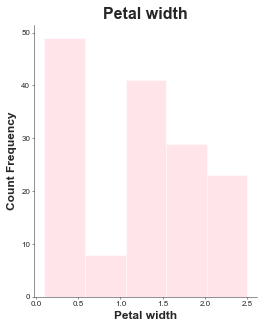
Advanced sytle options
Here are some examples where things like the bin, color and fig size have been changed.
[4]:
# histogram = Histogram(df: pd.DataFrame, x: object, title='', xlabel='', ylabel='', colour=None, normalise=False, fit_norm=False,
#                 plot_rug=False, plot_kde=False, plot_hist=True, bins=20, min_x=None, max_x=None, min_y=None, max_y=None,
#                 figsize=(3, 3), title_font_size=12, label_font_size=8, title_font_weight=700, config={}):
# Config options = any of the parameters with the same name but with in a dictionary format instead
histogram = Histogram(df=df, x='petal_width', title='Petal width', xlabel='Petal width', ylabel='Count',
                      colour='pink',
                      bins=5, # defaults to 20
                      # You could also pass these as individual parameters, but it's easier to set as a dictionary
                      # also, then you can re-use it for other charts!
                      config={'figsize':(4, 5),  # Size of figure (x, y)
                           'title_font_size': 16, # Size of the title (pt)
                           'label_font_size': 12, # Size of the labels (pt)
                           'title_font_weight': 700, # 700 = bold, 600 = normal, 400 = thin
                           'font_family': 'sans-serif', # 'serif', 'sans-serif', or 'monospace'
                           'font': ['Tahoma'] # Default: Arial  # http://jonathansoma.com/lede/data-studio/matplotlib/list-all-fonts-available-in-matplotlib-plus-samples/
                      })
histogram.plot()
plt.show()
/Users/ariane/opt/miniconda3/envs/clean_ml/lib/python3.6/site-packages/seaborn/distributions.py:2557: FutureWarning: `distplot` is a deprecated function and will be removed in a future version. Please adapt your code to use either `displot` (a figure-level function with similar flexibility) or `histplot` (an axes-level function for histograms).
  warnings.warn(msg, FutureWarning)
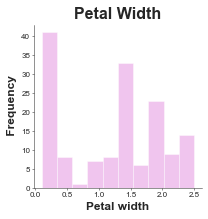
Saving
Saving is the same for all plots and v simple, just make sure you specify what ending you want it to have.
[6]:
histogram = Histogram(df, 'petal_width', xlabel='Petal width', title='Petal Width',
                      bins=10,
                      colour='orchid', fit_norm=False, plot_rug=False,
                      config={'palette': ['orchid', 'paleturquoise', 'gold'],
                           'figsize':(3, 3),  # Size of figure (x, y)
                           's': 20,
                           'title_font_size': 16, # Size of the title (pt)
                           'label_font_size': 12, # Size of the labels (pt)
                           'title_font_weight': 700, # 700 = bold, 600 = normal, 400 = thin
                           'font_family': 'sans-serif', # 'serif', 'sans-serif', or 'monospace'
                           'font': ['Tahoma'] # Default: Arial  # http://jonathansoma.com/lede/data-studio/matplotlib/list-all-fonts-available-in-matplotlib-plus-samples/
                           })
histogram.plot()
plt.savefig('histogram.svg', bbox_inches='tight') # .png, .pdf, .jpg
plt.savefig('histogram.png', dpi=300) # .png, .pdf, .jpg
plt.savefig('histogram.pdf') # .png, .pdf, .jpg
/Users/ariane/opt/miniconda3/envs/clean_ml/lib/python3.6/site-packages/seaborn/distributions.py:2557: FutureWarning: `distplot` is a deprecated function and will be removed in a future version. Please adapt your code to use either `displot` (a figure-level function with similar flexibility) or `histplot` (an axes-level function for histograms).
  warnings.warn(msg, FutureWarning)