SiRCle RCM Rules
Ariane Mora
Christina Schmidt
ChooseSettings.RmdSiRCle Regulatory Clustering Model
This notebook is meant as a guide for choosing the settings for the Signature Regulatory Clustering (SiRCle) dependent on the biological question of interest. This guide is divided into three main chapters that give an overview on the SiRcle method, each covering one of the main settings in the
sircleRCM() functions (Regulatory
Clustering Method) namely the “Background method (BG)”, the “Regulation
Grouping (RG)” and the thresholds/cutoffs of the input data.sircleRCM_MRP()
The original Regulatory Clustering Method (RCM)
sircleRCM_MRP() was developed to perform biologically
meaningful clustering integrating DNA methylation, mRNA, and protein
data at the gene level. Based on the differential analysis (e.g. Tumour
versus Normal), we defined three states, namely positive, negative or
unchanged, for each gene and data layer. Given that the protein
expression is the data layer closest to the phenotype, yet at the same
time has the lowest coverage, “No Change” is subdivided into four states
for the protein data layer, “Not Detected”, “Not Significant”,
“significant negative” and “significant positive”. For more details and
explanation check out the publication from Mora&Schmidt
et al. (Mora et al. 2024).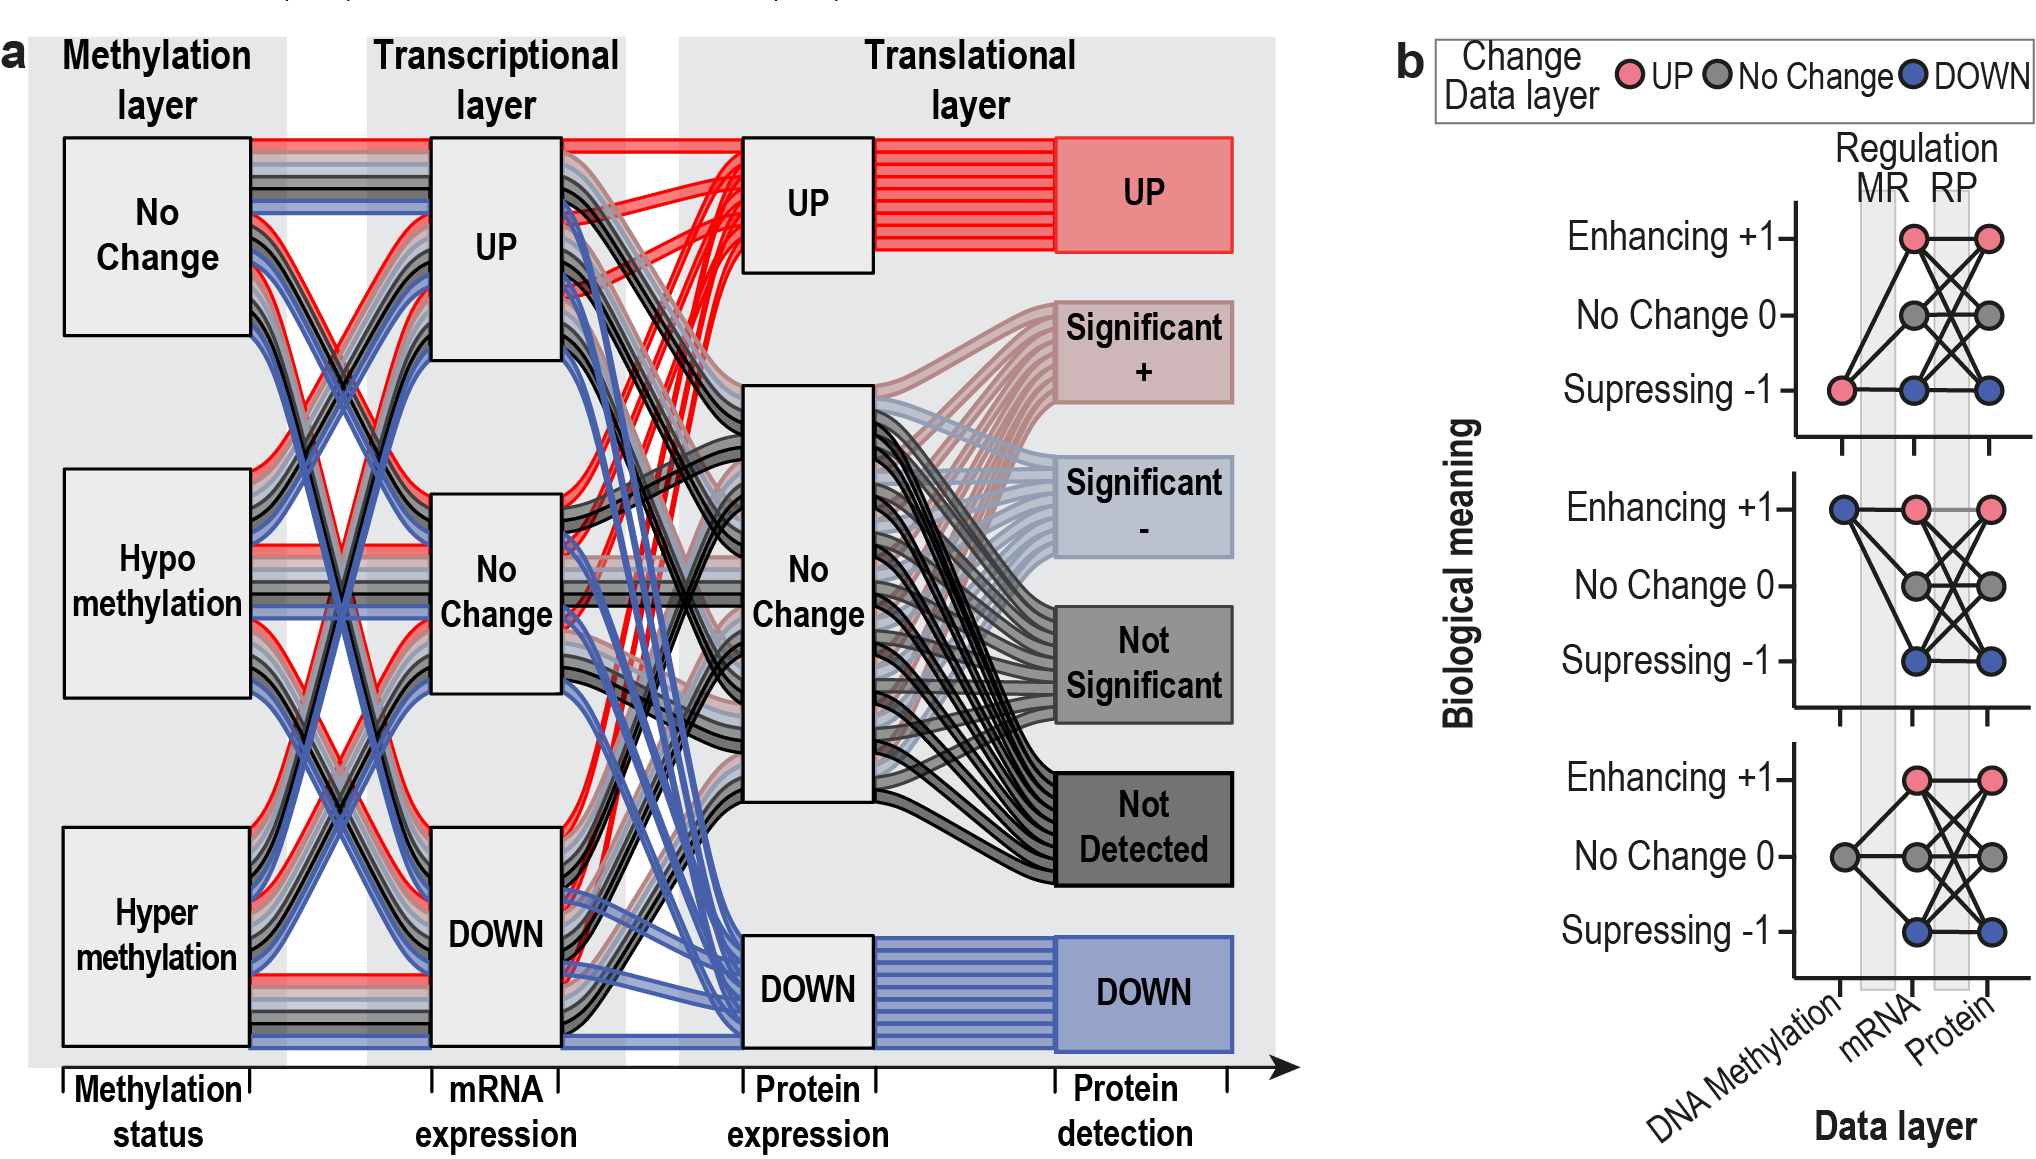
sircleRCM_RP()
It is likely that one only obtained data for the RNA and protein data layer. This is the reason why we also offer the option of the
sircleRCM_RP() function, which only uses RNAseq and
proteomics as input. The above principle stays the same, yet here we one
have two 3-state-6-state transitions between the data layers, a total of
18 possible “flows”.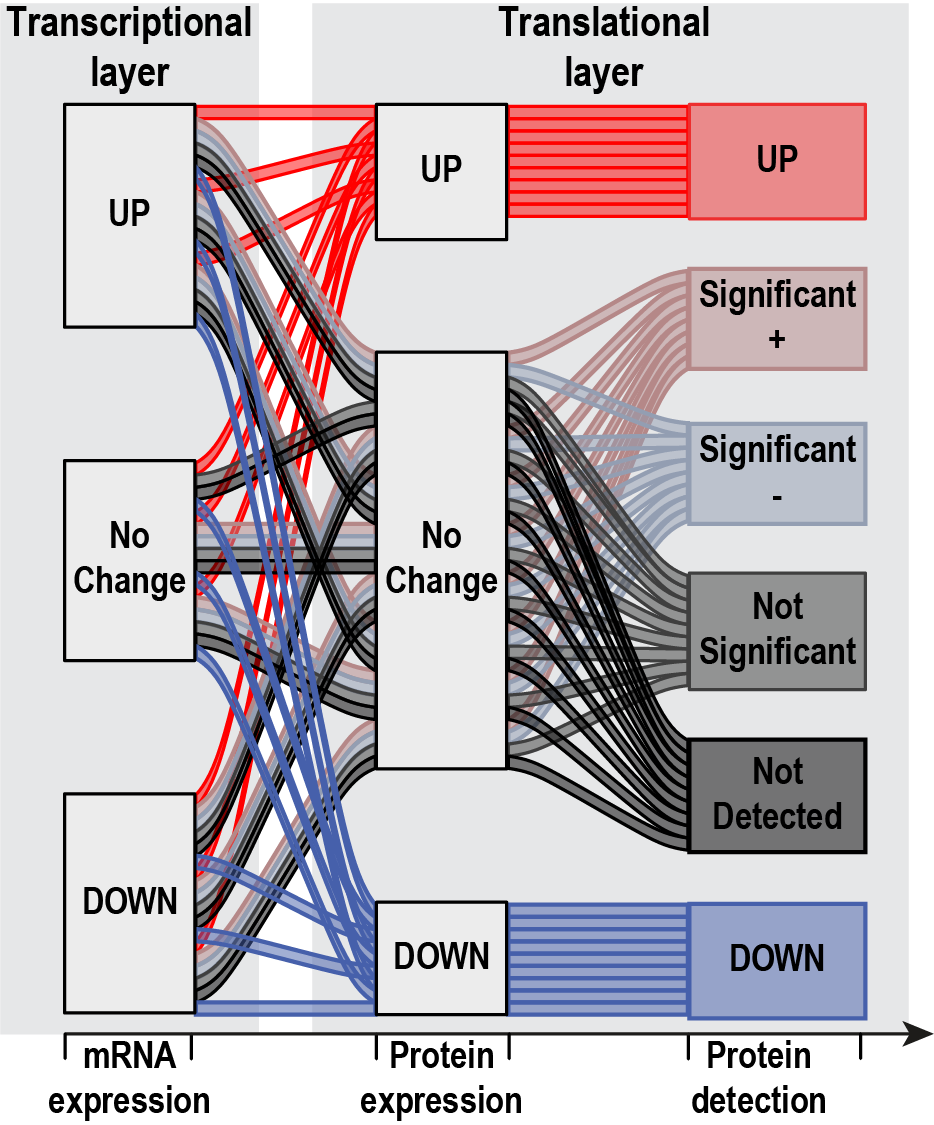
sircleRCM_2Cond()
Lastly, to enable the application of SiRCle RCM to any two data layers
of choice, we provide the sircleRCM_2Cond() function. Here
one can either input two different data layers, but also the same data
layers (e.g. RNAseq comparing KO versus WT in hypoxia and in normoxia).
In the above options we take into account that the protein expression is
the data layer closest to the phenotype, yet at the same time has the
lowest coverage. Here we want to give the full flexibility to the user
and hence we have a two 6-state-6-state transitions between the data
layers, a total of 36 possible “flows”.
In the next chapters we will discuss how to choose the “Background
method (BG)”, the “Regulation Grouping (RG)” and the thresholds/cutoffs
of the input data.
1. Background method (BG)
The Background setting defines, which features will be considered for the clusters. For example if you have two data layers, RNAseq and proteomics, you could include only features (= genes) that are detected in both data layers, removing the rest of the features.
Three data layers: Methylation, RNAseq and Proteomics
1.1. - 1.7. goes from most restrictive to
least restrictive. Hence the chosen background method will define the
number of genes included in the sircleRCM input. Given that
the proteomics data has the lowest coverage of the three input data
layers (Proteomics, RNAseq and DNA-methylation), the proteomics data
layer will have the lowest number of detected genes (=features) and
hence has the biggest impact on the number of genes included in the
sircleRCM input.
1.1. P&M&R
Most stringend background setting and will lead to a small number of
genes that is mainly dependent on the proteins detected (proteomics data
layer), since proteomics has the lowest coverage of the three
omics.
1.2. P&R
This background ensures to detect a gene in Proteomics and RNAseq.
Similar to 1.1, yet less stringent as the gene does not need to be
detected in DNA-Methylation.
1.3. P|(M&R)
Focus is on protein expression. Even though it is unlikely that
P&M&R (1.1.) or P&R (1.2.) excludes many proteins, a protein
could be excluded if it is not detected on the RNAseq and/or
DNA-methylation data layer. Hence, this background P | (M&R) (1.2.)
ensures to include all of the detected proteins (= all features on the
proteomics data layer). On the other hand it will also include genes
that are not detected on the protein layer (proteomics data), but on the
mRNA (RNAseq data) and on for DNA-methylation (DNA-methylation
data).
1.4. (P&M)|(P&R)
This background ensures to detect a gene in Proteomics and one of the
other two data layers. Similar to 1.1, yet less stringent as the gene
does not need to be detected in RNAseq and DNA-Methylation.
1.5. (P&M)|(P&R)|(M&R)
This background ensures to detect a gene in at least two of the three
data layers. Hence, the focus moves away from the protein layer
(proteomics data layer) and the number of genes that are not detected on
the proteomics data layer will increase in comparison to P & M &
R (1.1.) and P | (M&R) (1.2.).
1.6. P|R
A gene will be included in the SiRCle input if it has been detected on
one of the two data layers (proteomics or RNAseq).
1.7. P|M|R
Least stringent background method, since a gene will be included in the
SiRCle input if it has been detected on one of the three data layers
(proteomics, RNAseq or DNA-methylation).
Two data layers: RNAseq and Proteomics
As discussed above, often only RNAseq and Proteomics is conducted,
and hence there is the sircleRCM_RP() function focusing on
only those two data layers not requiring the DNA-methylation data. In
turn the background methods are the following from 1.1. -
1.4. from most restrictive to least restrictive:
1.1. P&R
Most stringend background setting and will lead to a small number of
genes that is mainly dependent on the proteins detected (proteomics data
layer), since proteomics has the lower coverage compared to
RNAseq.
1.2. P
Focus is on protein expression. Even though it is unlikely that P&R
(1.1.) excludes many proteins, a protein could be excluded if it is not
detected on the RNAseq data layer. Hence, this background ensures to
include all of the detected proteins (= all features on the proteomics
data layer).
1.3. R
Focus is on mRNA expression. P&R (1.1.) will exclude many genes from
the mRNA data layer, hence this background ensures to include all of the
detected mRNAs (= all features on the RNAseq data layer).
1.4. P|R
Least stringent background method, since a gene will be included in the
SiRCle input if it has been detected on one of the two data layers
(proteomics or RNAseq).
Two data sets
Here one can either input two different data layers or two different
conditions of the same data layer. In turn the background methods are
the following from 1.1. - 1.4. from most
restrictive to least restrictive:
1.1. C1&C2
Most stringend background setting and will lead to a small number of
genes.
1.2. C1
Focus is on The gene expression of Condition 1 (C1).
1.3. C2
Focus is on The gene expression of Condition 2 (C2).
1.4. C1|C2
Least stringent background method, since a gene will be included in the
SiRCle input if it has been detected on one of the two conditions.
2. Input data threshold
Here we can set two different thresholds, one for the differential
expression, which would mostly be Log2FC for the RNAseq and
proteomics data layer and
Differential Methylated Regions (DMR) for DNA-methylation,
and one for the significance (e.g. p.adj). This will define
if a feature (= e.g. gene) is assigned into:
1. “UP”, which means a feature is
significantly up-regulated in the underlying comparison.
2. “DOWN”, which means a feature is
significantly down-regulated in the underlying comparison.
3. “No Change”, which means a feature does not
change significantly in the underlying comparison and/or is not defined
as up-regulated/down-regulated based on the Log2FC threshold
chosen.
Given that the protein expression is the data layer closest to the
phenotype, yet at the same time has the lowest coverage, “No Change” is
subdivided into four states for the protein data layer:
1. “Not Detected”, which means a feature is
not detected in the underlying data layer.
2. “Not Significant”, which means a feature is
not significant in the underlying comparison.
3. “Significant negative”, which means a
feature is significant in the underlying comparison and the differential
expression is positive, yet does not meet the threshold set for “UP”
(e.g. Log2FC >1 = “UP” and we have a significant Log2FC=0.8).
4. “Significant positive”, which means a
feature is significant in the underlying comparison and the differential
expression is positive, yet does not meet the threshold set for
“DOWN”.
This definition is done individually for each data layer,(proteomics,
RNAseq, DNA-methylation) and will impact in which SiRCle cluster a gene
is sorted into. The latter will be discussed in detail below (see “3.
Regulation Grouping (RG)”).
3. Regulation Grouping (RG)
The results of the SirCle RCM includes different Regulation Groupings (RG), which define the SiRCle cluster a gene will be assigned to, therebye summarizing the flows into a smaller amount of SiRCle clusters. In brief, each SiRCle cluster reflects the regulation(s) that ultimately result in the protein expression and the names assigned to the SiRCle clusters reflect the biological meaning, namely “Enhancing (+1)” or “Suppressing (-1)”, of the regulation (see Fig. 1b). Hence, a regulation can happen between DNA methylation and mRNA expression (MR) and/or between mRNA expression and protein expression (RP). Each change of regulation that happens between the data layers will define the SiRCle cluster’s name. For example, if a gene is hypermethylated, has a decrease in mRNA expression, and displays a decrease in protein expression, we can likely conclude dysregulation first occurred on the DNA methylation layer, meaning this gene is suppressed via Methylation-Driven Suppression (MDS).
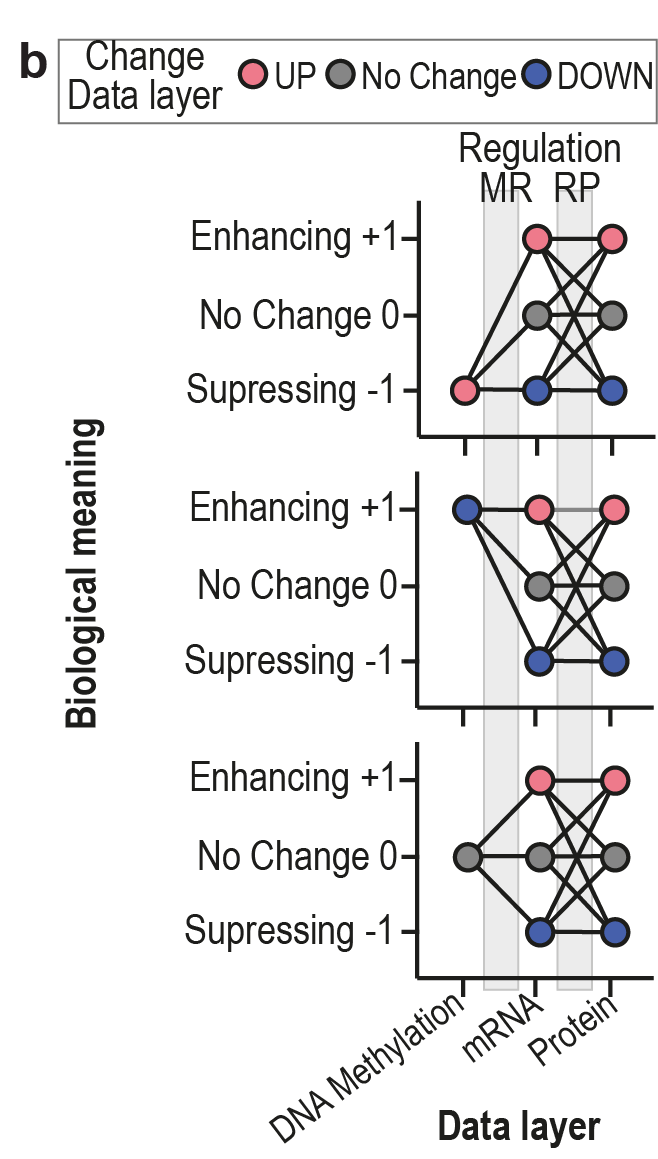
In Figure 1b, we see three different plots and in each plot we have 9 flows connecting the three data layers (DNA methylation, mRNA expression and Protein expression). This gives a total of 27 possible flows.
Given that our regulatory rules have the aim to reflects the regulation(s) that ultimately result in the protein expression, it becomes essential to deal with proteins assigned to “No Change”, since “No Change” on the protein level can mean:
1. “Not Detected”
2. “Not Significant”
3. “Significant negative”
4. “Significant positive”
Depending on the “RG” chosen by the user, different granularities of the regulations are considered, which can lead to SiRCle cluster names reflecting one (MR or RP) or two regulations (MR+RP) (see Table 1).
3.1. RG1: All
Column
RG1_All, which includes all 54 possible flows (=
ordered series of three 3-state-3-state-6-state transitions between the
data layers) as the output and does not summarizes multiple flows into a
SiRCle cluster.3.2. RG2: Focus Changes
Column
RG2_Changes, which summarizes the 54 possible flows
into 10 SiRCle clusters taking into account any changes between the data
layers (Table 1). Here we focus on changes and hence reflect any small
change between the data layers by including in in the SiRCle
cluster.3.3. RG3: Focus Translation
Column
RG3_Protein, which only take into account regulation
between mRNA expression and protein expression (RP). Meaning even if
tehre has been also a regulation between the DNA-methylation layer and
the RNA layer, this is ignored and the genes are just sorted based on
the secondary regulation on the translational level.3.4 RG4: Focus Detection
Column
RG4_Detection, will not take into account changes
between mRNA and protein layer if a protein has not been detected. In
this case only the regulation between DNA-methylation and RNA is taken
into account to define the SiRCle cluster. Of course, if one choses any
Background method that enforces the protein to be detected
(e.g. M&R&P), Column RG4_Detection will include the
same as RG3_Protein as the flow trough “Not Detected” can not
occur.| Methylation | RNA-seq | Proteomics | Proteomics_Detection | RG1_All | RG2_Changes | RG3_Protein | RG4_Detection |
|---|---|---|---|---|---|---|---|
| Hypermethylation | DOWN | DOWN | DOWN | Hypermethylation + DOWN + DOWN | MDS | MDS | MDS |
| Hypomethylation | DOWN | DOWN | DOWN | Hypomethylation + DOWN + DOWN | TPDS | TPDS | TPDS |
| No Change | DOWN | DOWN | DOWN | No Change + DOWN + DOWN | TPDS | TPDS | TPDS |
| Hypermethylation | No Change | DOWN | DOWN | Hypermethylation + No Change + DOWN | TMDS | TMDS | TMDS |
| Hypomethylation | No Change | DOWN | DOWN | Hypomethylation + No Change + DOWN | TMDS | TMDS | TMDS |
| No Change | No Change | DOWN | DOWN | No Change + No Change + DOWN | TMDS | TMDS | TMDS |
| Hypermethylation | UP | DOWN | DOWN | Hypermethylation + UP + DOWN | TPDE+TMDS | TMDS | TPDE+TMDS |
| Hypomethylation | UP | DOWN | DOWN | Hypomethylation + UP + DOWN | MDE+TMDS | TMDS | MDE+TMDS |
| No Change | UP | DOWN | DOWN | No Change + UP + DOWN | TPDE+TMDS | TMDS | TPDE+TMDS |
| No Change | No Change | No Change | No Change | No Change + No Change + No Change | None | None | None |
| Hypermethylation | DOWN | No Change | Not detected | Hypermethylation + DOWN + Not detected | MDS+TMDE | MDS | MDS |
| Hypomethylation | DOWN | No Change | Not detected | Hypomethylation + DOWN + Not detected | TPDS+TMDE | TPDS | TPDS |
| No Change | DOWN | No Change | Not detected | No Change + DOWN + Not detected | TPDS+TMDE | TPDS | TPDS |
| Hypermethylation | No Change | No Change | Not detected | Hypermethylation + No Change + Not detected | None | None | None |
| Hypomethylation | No Change | No Change | Not detected | Hypomethylation + No Change + Not detected | None | None | None |
| No Change | No Change | No Change | Not detected | No Change + No Change + Not detected | None | None | None |
| Hypermethylation | UP | No Change | Not detected | Hypermethylation + UP + Not detected | TPDE+TMDS | TPDE | TPDE |
| Hypomethylation | UP | No Change | Not detected | Hypomethylation + UP + Not detected | MDE+TMDS | MDE | MDE |
| No Change | UP | No Change | Not detected | No Change + UP + Not detected | TPDE+TMDS | TPDE | TPDE |
| Hypermethylation | DOWN | No Change | Not significant | Hypermethylation + DOWN + Not significant | MDS+TMDE | None | MDS+TMDE |
| Hypomethylation | DOWN | No Change | Not significant | Hypomethylation + DOWN + Not significant | TPDS+TMDE | None | TPDS+TMDE |
| No Change | DOWN | No Change | Not significant | No Change + DOWN + Not significant | TPDS+TMDE | None | TPDS+TMDE |
| Hypermethylation | No Change | No Change | Not significant | Hypermethylation + No Change + Not significant | None | None | None |
| Hypomethylation | No Change | No Change | Not significant | Hypomethylation + No Change + Not significant | None | None | None |
| No Change | No Change | No Change | Not significant | No Change + No Change + Not significant | TPDS+TMDE | None | None |
| Hypermethylation | UP | No Change | Not significant | Hypermethylation + UP + Not significant | TPDE+TMDS | None | TPDE+TMDS |
| Hypomethylation | UP | No Change | Not significant | Hypomethylation + UP + Not significant | MDE+TMDS | None | MDE+TMDS |
| No Change | UP | No Change | Not significant | No Change + UP + Not significant | TPDE+TMDS | None | TPDE+TMDS |
| Hypermethylation | DOWN | No Change | Significant negative | Hypermethylation + DOWN + Significant negative | MDS+TMDE | MDS | MDS |
| Hypomethylation | DOWN | No Change | Significant negative | Hypomethylation + DOWN + Significant negative | TPDS+TMDE | TPDS | TPDS |
| No Change | DOWN | No Change | Significant negative | No Change + DOWN + Significant negative | TPDS+TMDE | TPDS | TPDS |
| Hypermethylation | No Change | No Change | Significant negative | Hypermethylation + No Change + Significant negative | None | None | None |
| Hypomethylation | No Change | No Change | Significant negative | Hypomethylation + No Change + Significant negative | None | None | None |
| Hypermethylation | UP | No Change | Significant negative | Hypermethylation + UP + Significant negative | TPDE+TMDS | TMDS | TPDE+TMDS |
| Hypomethylation | UP | No Change | Significant negative | Hypomethylation + UP + Significant negative | MDE+TMDS | TMDS | MDE+TMDS |
| No Change | UP | No Change | Significant negative | No Change + UP + Significant negative | TPDE+TMDS | TMDS | TPDE+TMDS |
| Hypermethylation | DOWN | No Change | Significant positive | Hypermethylation + DOWN + Significant positive | MDS+TMDE | TMDE | MDS+TMDE |
| Hypomethylation | DOWN | No Change | Significant positive | Hypomethylation + DOWN + Significant positive | TPDS+TMDE | TMDE | TPDS+TMDE |
| No Change | DOWN | No Change | Significant positive | No Change + DOWN + Significant positive | TPDS+TMDE | TMDE | TPDS+TMDE |
| Hypermethylation | No Change | No Change | Significant positive | Hypermethylation + No Change + Significant positive | None | None | None |
| Hypomethylation | No Change | No Change | Significant positive | Hypomethylation + No Change + Significant positive | None | None | None |
| Hypermethylation | UP | No Change | Significant positive | Hypermethylation + UP + Significant positive | TPDE+TMDS | TPDE | TPDE |
| Hypomethylation | UP | No Change | Significant positive | Hypomethylation + UP + Significant positive | MDE+TMDS | MDE | MDE |
| No Change | UP | No Change | Significant positive | No Change + UP + Significant positive | TPDE+TMDS | TPDE | TPDE |
| Hypermethylation | DOWN | UP | UP | Hypermethylation + DOWN + UP | MDS+TMDE | TMDE | MDS+TMDE |
| Hypomethylation | DOWN | UP | UP | Hypomethylation + DOWN + UP | TPDS+TMDE | TMDE | TPDS+TMDE |
| No Change | DOWN | UP | UP | No Change + DOWN + UP | TPDS+TMDE | TMDE | TPDS+TMDE |
| Hypermethylation | No Change | UP | UP | Hypermethylation + No Change + UP | TMDE | TMDE | TMDE |
| Hypomethylation | No Change | UP | UP | Hypomethylation + No Change + UP | TMDE | TMDE | TMDE |
| No Change | No Change | UP | UP | No Change + No Change + UP | TMDE | TMDE | TMDE |
| Hypermethylation | UP | UP | UP | Hypermethylation + UP + UP | TPDE | TPDE | TPDE |
| Hypomethylation | UP | UP | UP | Hypomethylation + UP + UP | MDE | MDE | MDE |
| No Change | UP | UP | UP | No Change + UP + UP | TPDE | TPDE | TPDE |
Lastly, it is worth mentioning that in case where only RNAseq and
proteomics data are available and
sircleRCM_RP() was used, all the above stays
the same, yet all the flows and resulting SiRCle clusters that include
DNA-methylation are not available.
Using sircleRCM_2Cond() based on any two input
data, will provide RG1_All, RG2_Significant taking into account genes
that are significant (UP, DOWN, significant positive, significant
negative) and RG3_SignificantChange only takes into account genes that
have significant changes (UP, DOWN).
Session information
## ─ Session info ───────────────────────────────────────────────────────────────────────────────────────────────────────
##  setting  value
##  version  R version 4.4.1 (2024-06-14 ucrt)
##  os       Windows 10 x64 (build 19045)
##  system   x86_64, mingw32
##  ui       RTerm
##  language en
##  collate  English_United Kingdom.utf8
##  ctype    English_United Kingdom.utf8
##  tz       Europe/Berlin
##  date     2025-01-15
##  pandoc   3.2 @ C:/Program Files/RStudio/resources/app/bin/quarto/bin/tools/ (via rmarkdown)
##
## ─ Packages ───────────────────────────────────────────────────────────────────────────────────────────────────────────
##  package     * version date (UTC) lib source
##  bslib         0.8.0   2024-07-29 [1] CRAN (R 4.4.1)
##  cachem        1.1.0   2024-05-16 [1] CRAN (R 4.4.1)
##  cli           3.6.3   2024-06-21 [1] CRAN (R 4.4.1)
##  colorspace    2.1-1   2024-07-26 [1] CRAN (R 4.4.1)
##  desc          1.4.3   2023-12-10 [1] CRAN (R 4.4.1)
##  digest        0.6.37  2024-08-19 [1] CRAN (R 4.4.1)
##  dplyr       * 1.1.4   2023-11-17 [1] CRAN (R 4.4.1)
##  evaluate      1.0.1   2024-10-10 [1] CRAN (R 4.4.2)
##  fastmap       1.2.0   2024-05-15 [1] CRAN (R 4.4.1)
##  forcats     * 1.0.0   2023-01-29 [1] CRAN (R 4.4.1)
##  fs            1.6.4   2024-04-25 [1] CRAN (R 4.4.1)
##  generics      0.1.3   2022-07-05 [1] CRAN (R 4.4.1)
##  ggplot2     * 3.5.1   2024-04-23 [1] CRAN (R 4.4.1)
##  glue          1.7.0   2024-01-09 [1] CRAN (R 4.4.1)
##  gtable        0.3.6   2024-10-25 [1] CRAN (R 4.4.2)
##  hms           1.1.3   2023-03-21 [1] CRAN (R 4.4.1)
##  htmltools     0.5.8.1 2024-04-04 [1] CRAN (R 4.4.1)
##  htmlwidgets   1.6.4   2023-12-06 [1] CRAN (R 4.4.1)
##  jquerylib     0.1.4   2021-04-26 [1] CRAN (R 4.4.1)
##  jsonlite      1.8.9   2024-09-20 [1] CRAN (R 4.4.1)
##  kableExtra  * 1.4.0   2024-01-24 [1] CRAN (R 4.4.1)
##  knitr         1.49    2024-11-08 [1] CRAN (R 4.4.2)
##  lifecycle     1.0.4   2023-11-07 [1] CRAN (R 4.4.1)
##  lubridate   * 1.9.3   2023-09-27 [1] CRAN (R 4.4.1)
##  magrittr      2.0.3   2022-03-30 [1] CRAN (R 4.4.1)
##  munsell       0.5.1   2024-04-01 [1] CRAN (R 4.4.1)
##  pillar        1.10.1  2025-01-07 [1] CRAN (R 4.4.1)
##  pkgconfig     2.0.3   2019-09-22 [1] CRAN (R 4.4.1)
##  pkgdown       2.1.1   2024-09-17 [1] CRAN (R 4.4.1)
##  purrr       * 1.0.2   2023-08-10 [1] CRAN (R 4.4.1)
##  R6            2.5.1   2021-08-19 [1] CRAN (R 4.4.1)
##  ragg          1.3.3   2024-09-11 [1] CRAN (R 4.4.1)
##  readr       * 2.1.5   2024-01-10 [1] CRAN (R 4.4.1)
##  rlang         1.1.4   2024-06-04 [1] CRAN (R 4.4.1)
##  rmarkdown   * 2.29    2024-11-04 [1] CRAN (R 4.4.2)
##  rstudioapi    0.17.1  2024-10-22 [1] CRAN (R 4.4.2)
##  sass          0.4.9   2024-03-15 [1] CRAN (R 4.4.1)
##  scales        1.3.0   2023-11-28 [1] CRAN (R 4.4.1)
##  sessioninfo   1.2.2   2021-12-06 [1] CRAN (R 4.4.1)
##  stringi       1.8.4   2024-05-06 [1] CRAN (R 4.4.0)
##  stringr     * 1.5.1   2023-11-14 [1] CRAN (R 4.4.1)
##  svglite       2.1.3   2023-12-08 [1] CRAN (R 4.4.1)
##  systemfonts   1.1.0   2024-05-15 [1] CRAN (R 4.4.1)
##  textshaping   0.4.0   2024-05-24 [1] CRAN (R 4.4.1)
##  tibble      * 3.2.1   2023-03-20 [1] CRAN (R 4.4.1)
##  tidyr       * 1.3.1   2024-01-24 [1] CRAN (R 4.4.1)
##  tidyselect    1.2.1   2024-03-11 [1] CRAN (R 4.4.1)
##  tidyverse   * 2.0.0   2023-02-22 [1] CRAN (R 4.4.1)
##  timechange    0.3.0   2024-01-18 [1] CRAN (R 4.4.1)
##  tzdb          0.4.0   2023-05-12 [1] CRAN (R 4.4.1)
##  vctrs         0.6.5   2023-12-01 [1] CRAN (R 4.4.1)
##  viridisLite   0.4.2   2023-05-02 [1] CRAN (R 4.4.1)
##  withr         3.0.2   2024-10-28 [1] CRAN (R 4.4.2)
##  xfun          0.49    2024-10-31 [1] CRAN (R 4.4.2)
##  xml2          1.3.6   2023-12-04 [1] CRAN (R 4.4.1)
##  yaml          2.3.10  2024-07-26 [1] CRAN (R 4.4.1)
##
##  [1] C:/Users/chris/AppData/Local/R/win-library/4.4
##  [2] C:/Program Files/R/R-4.4.1/library
##
## ──────────────────────────────────────────────────────────────────────────────────────────────────────────────────────